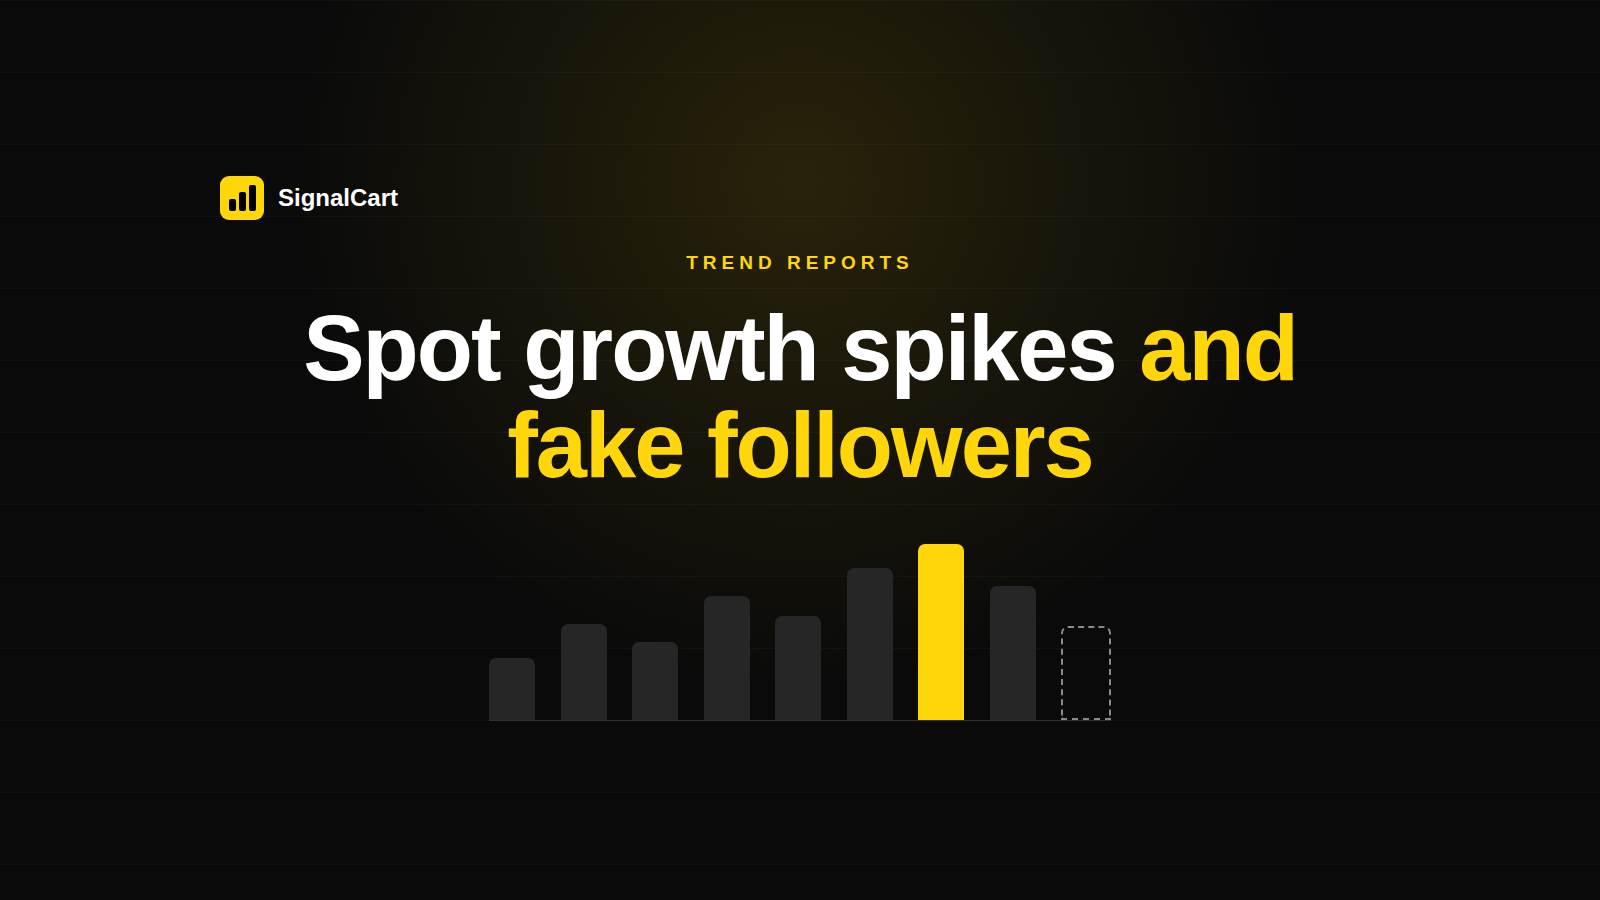
A TikTok follower tracker records a public profile's follower count on a schedule, then reports the daily deltas next to views, likes and video count. History, not a live counter, is what reveals growth spikes and suspicious jumps — a spike with flat engagement is the first signal of purchased or bot followers.
A TikTok follower tracker measures one thing reliably: the public follower count of an account, read either as a live number that refreshes every few seconds or as a stored daily snapshot you can compare over time. The useful trackers do the second job, because a follower count on its own tells you almost nothing until you can see its deltas next to views, likes, video count, and creator GMV.
What a TikTok Follower Tracker Actually Measures (and What It Can't)
Most tools marketed as a TikTok follower tracker are built for one of two distinct jobs, and buyers routinely confuse them.
- A live counter polls a public profile every 5 to 30 seconds and displays the current count. It is a pulse check. It is good for watching a launch day or a livestream, and it is structurally bad at answering anything that requires memory.
- A history logger snapshots the same profile on a schedule, usually daily, and reports deltas week over week. It answers the questions that matter for vetting and benchmarking: how fast is this account growing, when did the growth start, and did it hold?
Two tools can legitimately show different numbers for the same account on the same day, and that is not necessarily a bug. TikTok abbreviates public counts above 10,000 rather than showing exact figures, so a profile may render as 128.4K while an API reading returns a longer integer from a slightly different moment or a cached response. Polling time, cache refresh, and whether an account was removed between reads all shift the number. This is the practical reason deltas over a fixed window beat any single snapshot: a 40-follower difference between two tools is noise, while a 3,000-follower jump across seven days on a slow-growing account is a signal worth investigating.
Set expectations early. Follower count alone is a vanity metric. It becomes diagnostic only when bucketed next to three companions: like volume, video count (how much output produced that growth), and view velocity (whether reach is rising alongside the audience). An account adding followers while median views stay flat is telling you something different from an account where views and followers rise together.
How to Track TikTok Follower Growth Over Time (Free and Paid Workflows)
The manual baseline
Before buying anything, build a two-week baseline by hand. Pick the account, log the same public profile at the same hour every day, and chart it in a spreadsheet. Note the anomalies as you go: flat days, step jumps inside a single day, and slow decay after a spike. This exercise costs you twenty minutes total and does something no dashboard can, which is teach you what normal growth looks like for that account and that niche. If you cannot explain a jump on the chart, you have found your first research question.
The free-tool tier
Free follower checkers and no-login live counters are fine for one-off lookups: a quick sanity check on a creator before a call, or a pulse read during a product launch. What they structurally cannot give you is retention. There is no stored history, no cross-account comparison, and no exportable dataset. You get a number on a page, and you get it again tomorrow with no memory of today. For a single creator decision that may be enough. For scoring a hundred creators, it is not a workflow at all.
The API tier
An API tracker snapshots public TikTok profiles on a schedule and stores the results, so follower history, engagement, and creator GMV land in one dataset your team can query instead of screenshotting counters into a deck. SignalCart is built for this: one API for e-commerce and social media data across Amazon, TikTok Shop, Instagram, and YouTube, using public data only. Practically, that means the same pipeline that logs follower deltas can also pull follower and video metrics from TikTok's analytics API, giving you the product and creator metrics you need to interpret them.
If you are building the monitor yourself, the operational details matter more than the endpoint. SignalCart's write-up on TikTok analyzer APIs covers pulling public TikTok data reliably with proxies, rate limits, and request patterns that avoid blocks, which is exactly the layer where DIY follower-growth monitors tend to fail after week three.
Reading a Sudden Follower Spike: Virality, Promotion, or Padding
A spike is not a conclusion. It is an event with a signature, and the signature usually tells you which of three causes you are looking at.
Legitimate spike signature
A video breaks out. Views and likes rise first, within hours not days, and followers follow behind them as viewers decide to subscribe. The follower curve bends after the reach curve, not before it. The new followers show normal profile patterns, the account's median view count lifts for a period, and engagement rate holds roughly in line with its prior range rather than collapsing as a large block of inactive accounts dilutes the denominator.
Suspicious spike signature
Followers jump in a single block with no matching lift in views or engagement. Growth outpaces video-level reach, meaning the account gained more followers than its content plausibly reached. The step is a step, not a curve: one day flat, next day up by thousands. Sometimes the count partially decays afterward as accounts are removed, which is itself informative. Promotional pushes and cross-promotion can create fast jumps too, so treat the signature as a flag, not a verdict, and check whether a corresponding campaign or collab exists.
The three-day rule
Build a simple threshold into your monitoring: flag any account whose follower delta exceeds its trailing baseline by a set multiple, then wait three days before acting. Three days is usually enough for a viral spike to convert into sustained views, for a purchased block to start decaying, and for you to check the account's engagement and creator GMV trend against the new follower level. If followers tripled and GMV did not move, you have learned something worth more than the follower number.
Spotting Fake Followers: Signals That Outlive the Noise
No tracker can certify an audience as fake. What trackers can do is give you ratio tests and history patterns that put an account's follower count in context, so you weight it instead of trusting it.
- Follower-to-view ratio. Compare median views against follower count. A massive audience with almost no median views is the classic anomaly. In SignalCart's creator comparison, justmaiko shows 49,639,668 followers against a median view count of 19,857, a median views per follower ratio of 0, and a 7.1% engagement rate. Whatever explains that gap, it means follower count alone would badly misprice the account.
- Likes-to-view ratio. Consistency here matters more than the absolute value. A sudden drop in likes per view alongside rising followers suggests the new audience is not watching.
- Comments-to-follower ratio. Very low comment volume against a large, recently spiked audience is a soft flag, especially when it appears only on the most recent posts.
- Shape of the curve. Bursts versus a smooth curve. Organic growth is lumpy but continuous; purchased growth arrives in steps.
When you have no demographic access, use audience-quality proxies instead: comment relevance to the actual video content, language spread consistent with the creator's stated market, duplicate or emoji-only comments clustered on a handful of posts, and engagement concentration where 80% of interaction sits on two videos while the rest flatline. These are proxies, not proof.
It also helps to know that high reach and high engagement do not move together as neatly as people assume. dixiedamelio shows 53,563,358 followers, 12,217,260 median views, a 0.23 median views per follower ratio, and a 2.5% engagement rate, which is a very different profile from accounts with a tenth of the audience. The table below shows how widely these ratios vary even among the largest accounts on the platform.
| Handle | Followers | Median views | Median views per follower | Engagement rate |
|---|---|---|---|---|
| charlidamelio | 160,350,674 | 5,297,001 | 0.03 | 8.3% |
| bellapoarch | 91,501,072 | 1,212,684 | 0.01 | 6.7% |
| addisonre | 87,629,924 | 6,969,442 | 0.08 | 8.2% |
| zachking | 86,791,085 | 10,988,308 | 0.13 | 9.8% |
| willsmith | 77,968,384 | 989,845 | 0.01 | 9.5% |
| jasonderulo | 66,463,005 | 3,225,950 | 0.05 | 9.1% |
| dixiedamelio | 53,563,358 | 12,217,260 | 0.23 | 2.5% |
| spencerx | 53,401,352 | 1,430,660 | 0.03 | 6% |
| brentrivera | 50,953,336 | 4,393,370 | 0.09 | 10.7% |
| justmaiko | 49,639,668 | 19,857 | 0 | 7.1% |
TikTok creators compared by follower count, median views, views per follower, and engagement rate for spotting fake-follower signals. Source: SignalCart Data (TikTok creators, data as of 2026-11-06).
Use follower history as one weighted input in a creator vetting score grounded in TikTok fake-follower detection benchmarks, never as a standalone pass or fail. SignalCart's comparison of free checkers, paid tools, and API audits walks through which results deserve trust, and the same logic applies to TikTok.
Free Live Counters vs. API Trackers: Choosing the Right Tool for Your Job
Tool choice should follow the task, not the price list.
- Live counter: a launch-day pulse check on one account, or a quick read before a call.
- History logger: growth curves, spike diagnosis, and week-over-week deltas on a defined set of accounts.
- API pipeline: scoring hundreds of creators, benchmarking competitors at scale, and joining follower data to product and creator GMV metrics in one query.
When you evaluate options, apply the same five criteria: refresh interval and polling source (is the number pulled live or served from cache), whether history is actually stored and for how long, comparison and export features, data licensing for public data, and published rate limits. A tool that fails on stored history is a counter, no matter what the landing page calls it.
As for the competitive field, Kalodata and FastMoss lean on TikTok Shop and product data, and Jungle Scout on Amazon. They are strong at what they target. If your workflow spans TikTok follower and creator tracking, TikTok Shop product research, Instagram creator vetting, and Amazon product research, a unified public-data API reduces tool sprawl, fewer logins, one schema, and one place where your follower history lives next to your commerce data. SignalCart's influencer search guide covers follower count, niche, and age filters plus the vetting checks that catch fake followers, which ports directly into a TikTok tracking workflow.
Putting Follower Data to Work: Creator Vetting and Competitive Benchmarks
The point of tracking follower deltas is a shortlist you trust. Pair growth rate with creator GMV and engagement so you separate accounts that are genuinely compounding from suspicious accounts you should audit before trusting new followers. A creator adding followers smoothly while median views hold and GMV trends up is a very different asset from one with an identical follower count and a flat view line.
Follower tier gives you the context to read those numbers. SignalCart telemetry on TikTok creators grouped by follower tier shows that engagement rate is remarkably stable across tiers, while median views scale steeply, which means a view-count comparison across tiers without tier context is close to meaningless.
| Follower tier | Creators count | Avg engagement rate | Avg median views |
|---|---|---|---|
| 1. Under 10K | 69,420 | 8.6% | 1,086 |
| 2. 10K-50K | 57,350 | 8.2% | 5,499 |
| 3. 50K-250K | 163,399 | 9.5% | 20,391 |
| 4. 250K-1M | 45,916 | 9.5% | 61,456 |
| 5. 1M+ | 14,736 | 9.8% | 246,051 |
TikTok creators grouped by follower tier with average engagement rate and median views for creator vetting and competitive benchmarking. Source: SignalCart Data (TikTok creators, data as of 2026-11-06).
Read the table as a benchmark set, not a ranking. The under-10K tier (69,420 creators, 8.6% average engagement rate, 1,086 average median views) and the 50K-250K tier (163,399 creators, 9.5% average engagement rate, 20,391 average median views) have similar engagement but wildly different reach, so an account beating its tier's median views is the meaningful comparison. The 1M+ tier (14,736 creators, 9.8% average engagement rate, 246,051 average median views) sets a different bar entirely.
Competitive benchmarking works the same way at smaller scale. Track 5 to 20 accounts in your niche for a month and you establish how much follower growth is normal for your category. That single baseline converts an isolated spike from a curiosity into a readable signal, because you now know whether a 4,000-follower week is exceptional or routine for that segment.
Then wire it into operations: build social media monitoring dashboards that schedule recurring snapshots, alert on threshold breaches rather than checking manually, and route the same feed into affiliate and creator-sourcing decisions. Follower tracking stops being an occasional report and becomes the input layer for who you work with and what you expect them to deliver.
FAQ
How do you track TikTok follower growth?
Snapshot the public follower count on a fixed schedule, usually once a day, and store each reading so you can compare deltas week over week. Pair those deltas with views, likes and video count to see whether growth came from content or from a purchase.
What does a sudden follower spike mean?
It usually means one video or livestream broke out of its usual reach, so check whether views and likes rose at the same time. A spike with flat views and engagement is more likely purchased or bot followers than a genuine viral moment.
Can a follower tracker detect fake followers?
Not directly — no public counter shows follower quality. Trackers flag the pattern instead: a sharp jump with no matching lift in views, likes or comments, or growth that arrives in round, evenly spaced batches.
How to track TikTok followers over time?
Keep a daily snapshot log per account rather than relying on a live counter, which has no memory. Store the date, exact count reading, and the same-day views and likes, then review week-over-week deltas to separate steady growth from one-off spikes.

by Nadia Torres, Social Commerce & Trend Research Analyst
Nadia Torres covers social commerce and cross-platform trend research, from rising TikTok Shop products to breakout Reels, YouTube Shorts sounds, and creator discovery. She explains how to compare growth across platforms, validate an early signal against marketplace data, and avoid treating every viral post as durable demand. Her articles turn public product and creator data into clear research workflows for sellers and marketers.